 Mathew K Analytics
Lesson 19 · Data Mining
Master Logistic Regression for Binary Classification: Step-by-Step Practical Guide
Welcome! This week we explore Logistic Regression for classification problems. Logistic Regression predicts categories, like: Will a phone customer churn?…
- CourseData Mining
- Lesson19 of 31
- Video15 min
- FormatJupyter notebook · 16 code cells
What you'll learn
Data
No separate download needed — the notebook creates or downloads everything it uses.
📓 Full notebook
Download .ipynbWeek 56: Logistic Regression for Classification#
Welcome! This week we explore Logistic Regression for classification problems. Logistic Regression predicts categories, like: Will a phone customer churn?
We use the Telecom Customer Churn Dataset. Let's dive in!
# Suppress warnings for clean output
import warnings; warnings.filterwarnings("ignore")
import numpy as np
np.random.seed(42)
# Data setup (Telecom Customer Churn Dataset)
import pandas as pd
url = 'https://raw.githubusercontent.com/IBM/telco-customer-churn-on-icp4d/master/data/Telco-Customer-Churn.csv'
df = pd.read_csv(url)
print(df.shape)
print(df.head(3))
What is Logistic Regression?#
Logistic Regression helps us predict a category. It is great for problems like: Is a customer likely to leave (churn) or stay?
The model gives us probabilities, and predicts yes or no.
# Take a quick look at how many customers churned
df['Churn'].value_counts()
# Check for missing data
df.isnull().sum().sort_values(ascending=False).head(5)
# See column data types
df.dtypes.head(8)
# Clean up TotalCharges  convert to numeric, fill missing values with median
df['TotalCharges'] = pd.to_numeric(df['TotalCharges'], errors='coerce')
df['TotalCharges'].fillna(df['TotalCharges'].median(), inplace=True)
# Quick stats for numeric columns
df.describe()
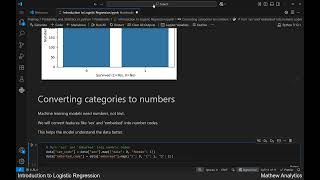
# Convert categorical columns to numbers
df['Churn'] = df['Churn'].map({'Yes': 1, 'No': 0})
df['gender'] = df['gender'].map({'Male': 1, 'Female': 0})
# Pick features for our model
features = ['tenure', 'MonthlyCharges', 'TotalCharges', 'gender']
X = df[features]
y = df['Churn']
# Split data into training and test sets
from sklearn.model_selection import train_test_split
X_train, X_test, y_train, y_test = train_test_split(X, y, test_size=0.2, random_state=42)
# Create and train Logistic Regression model
from sklearn.linear_model import LogisticRegression
model = LogisticRegression(max_iter=200, solver='liblinear')
model.fit(X_train, y_train)
# Predict churn on the test set
y_pred = model.predict(X_test)
print(y_pred[:10])
# Evaluate accuracy
from sklearn.metrics import accuracy_score
accuracy = accuracy_score(y_test, y_pred)
print("Accuracy:", accuracy)
# See model probabilities
y_proba = model.predict_proba(X_test)
print(y_proba[:5])
# Visualize results: plot confusion matrix
import matplotlib.pyplot as plt
from sklearn.metrics import ConfusionMatrixDisplay
fig, ax = plt.subplots(figsize=(5, 5))
ConfusionMatrixDisplay.from_estimator(model, X_test, y_test, ax=ax)
plt.title('Churn Prediction: Confusion Matrix')
plt.show()

Try it yourself! Practice predicting with new values#
Can you make a prediction for a new customer with the model? What values would you use?
# Input your own example and predict
print("Enter tenure (months): ")
tenure = int(input())
print("Enter monthly charges: ")
monthly = float(input())
print("Enter total charges: ")
total = float(input())
print("Enter gender (1 for male, 0 for female): ")
gender = int(input())
sample = [[tenure, monthly, total, gender]]
prediction = model.predict(sample)
print("Predicted churn (1=Yes, 0=No): ", prediction[0])
Recap & Whats Next#
This week, you learned to clean data, choose features, train and test a logistic regression model, and interpret results. Practice makes perfect! Experiment with other datasets and try different features.
Next: More on classification models, and fine-tuning your results.
Challenge: Change the Features#
Try changing which columns are used as features. See if your predictions and model accuracy change.
Optional: Use a different dataset and compare results.
Thank you for learning with us! To keep going, subscribe and join our next lesson!
Found this useful?
All lessons, notebooks and datasets here are free. If they helped you, a coffee keeps new lessons coming.
Related lessons
 23 min
Predicting Heart Disease with Logistic Regression: A Step-by-Step Python Guide
 17 min
Applying Linear Regression to the Boston Housing Dataset: A Step-by-Step Guide
 23 min
Deep Learning for Wine Type Classification: Step-by-Step Model Training Guide
 12 min