Mathew K Analytics

My books: learn Python, data analytics and SQL

The lessons on this site are free and will stay that way. Some people prefer to learn from a book, with everything in one order and exercises that come with answers, so I've written six. Here's what each one covers, who it's for and where to start.

Which book should you start with?

Together they make a path: Python basics first, then analysis with pandas in Jupyter, with SQL alongside whenever your data lives in a database. That is the same order most analysts I've worked with learned in, and the order I'd learn in again.

Every book uses one fictional business from start to finish, so the examples build on each other instead of jumping between toy datasets. The practice files are free on GitHub, so you can see exactly what you'll be working with before you buy.

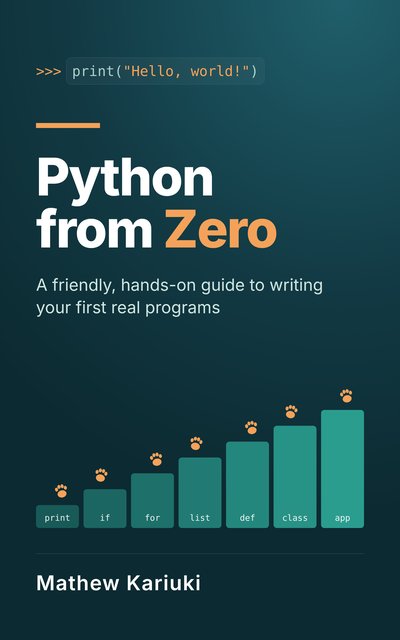
Cover of Python from Zero

Complete beginners

Python from Zero

A friendly, hands-on guide to writing your first real programs

Never written a line of code? Start here. You learn Python by building real tools for Sunny Paws, a small animal shelter, one small step at a time: a fee calculator, a feeding schedule, animal records and a donations report. In the last project you put it all together into a complete Shelter Manager program with menus, saved data and its own tests.

What you'll learn

  • Installing Python and JupyterLab, and running code three ways
  • Variables, text, decisions with if, and loops
  • Lists, dictionaries, functions and modules
  • Reading tracebacks calmly and fixing the errors beginners really make
  • Files, CSV and JSON, and automating everyday chores
  • Testing with pytest and planning a complete program from a blank page
📂 Free practice files on GitHub

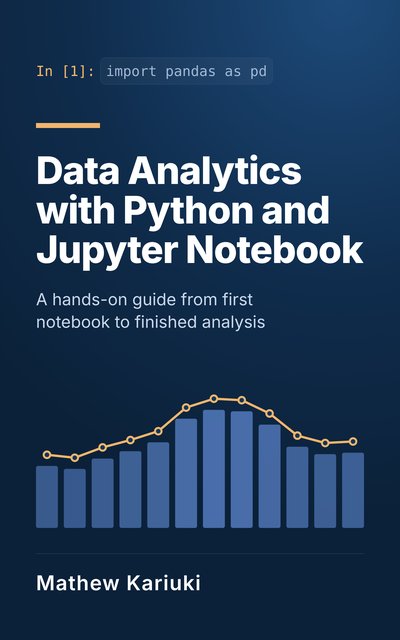
Cover of Data Analytics with Python and Jupyter Notebook

Beginners who know a little Python

Data Analytics with Python and Jupyter Notebook

A hands-on guide from first notebook to finished analysis

The full analyst workflow in Jupyter, from loading a messy file to presenting a finished analysis. You work through NumPy, pandas, cleaning, joining, dates and time series, exploratory analysis, charts in Matplotlib, seaborn and Plotly, the statistics analysts actually use and a first predictive model. It finishes with a capstone annual review for Bean There, a fictional coffee business.

What you'll learn

  • Working comfortably in Jupyter Notebook
  • pandas from the basics to grouping, reshaping and merging
  • Cleaning data and working with dates and time series
  • Exploratory analysis and clear charts with Matplotlib, seaborn and Plotly
  • Statistics for analysts and a first look at predictive modelling
  • Communicating results so people act on them

📂 Free practice files on GitHub

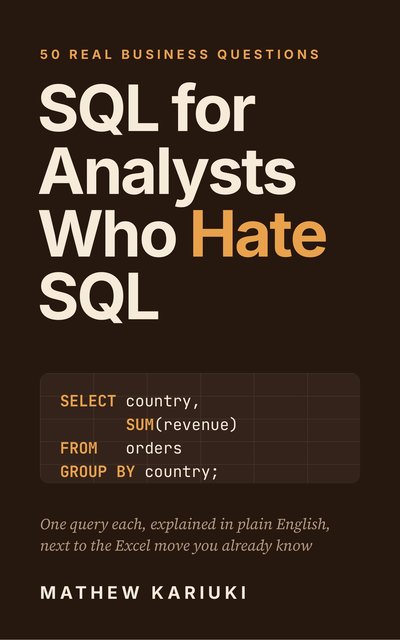
Cover of SQL for Analysts Who Hate SQL

Excel users moving to SQL

SQL for Analysts Who Hate SQL

50 real business questions, one query each, explained in plain English

If you are good in Excel but stuck waiting for someone else to pull the data, this book is for you. It teaches SQL through 50 questions managers really ask, each answered with one query and explained line by line next to the Excel move you already know. Every example runs on a free practice database for Bean & Leaf Co., an online coffee and tea shop with deliberately messy data.

What you'll learn

  • Swapping pivot tables for GROUP BY and VLOOKUPs for joins
  • Cleaning messy data, handling blanks and working with dates
  • Ranking, comparing periods and running totals with window functions
  • Churn, cohort retention, lifetime value and marketing return
  • Checking your numbers before anyone else does
  • Notes for PostgreSQL, SQL Server, MySQL and BigQuery

📂 Free practice files on GitHub

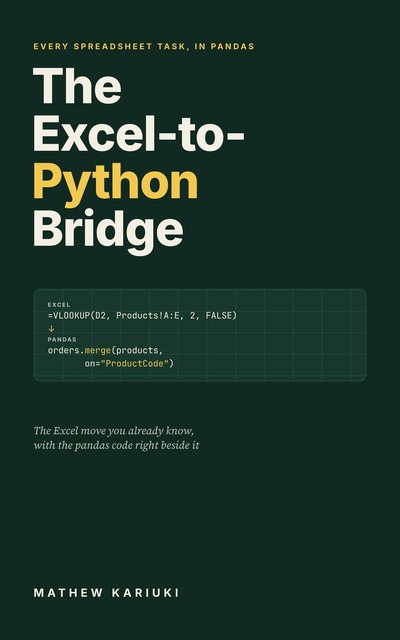
Cover of The Excel-to-Python Bridge

Excel users starting Python

The Excel-to-Python Bridge

Every spreadsheet task you already know, translated into pandas side by side

You already analyse data in Excel. This book shows you how to do the same work in Python, one familiar task at a time. VLOOKUP becomes a merge, SUMIFS becomes a groupby, a pivot table becomes pivot_table, and a two-hour monthly report becomes one command. Every example runs on one realistic company workbook, with the real output printed and plain-English notes.

What you'll learn

  • Loading workbooks and CSV files and exploring them the way you would in Excel
  • Replacing VLOOKUP, XLOOKUP and INDEX/MATCH with merges that never break
  • Turning SUMIFS, COUNTIFS and pivot tables into one-line summaries
  • Cleaning messy exports: spaces, dates, duplicates, numbers stored as text
  • Combining dozens of files and reshaping wide sheets
  • Writing formatted Excel reports and automating a monthly report

📂 Free practice files on GitHub

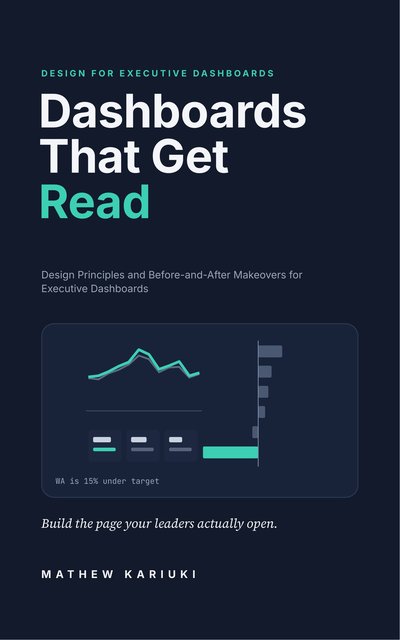
Cover of Dashboards That Get Read

Analysts and BI developers

Dashboards That Get Read

Design principles and before-and-after makeovers for executive dashboards

Most dashboards are built carefully and then ignored. Follow an analyst at a fictional Australian retailer as she replaces a cluttered twelve-tile executive dashboard with a single page that now opens every leadership meeting. Every principle is shown on real charts, before and after, with Power BI and Tableau steps and seven full makeovers.

What you'll learn

  • Scoping a dashboard around a decision with a one-page brief
  • Choosing three to six KPIs that balance each other
  • Laying out a page that passes the five-second test
  • Picking the right chart, and retiring gauges, pies and dual axes
  • Using colour with a purpose: grey, one accent, red only for problems
  • Building it in Power BI or Tableau and keeping it in use

The paperback and Kindle editions are coming to Amazon soon.

📂 Free practice files on GitHub

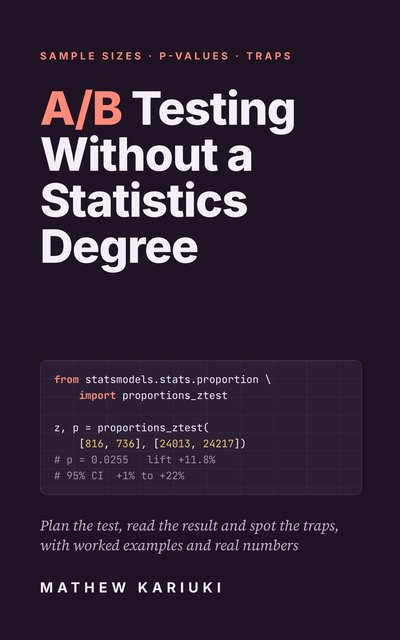
Cover of A/B Testing Without a Statistics Degree

Analysts, product managers and marketers

A/B Testing Without a Statistics Degree

Sample sizes, significance and the traps that fool smart teams

Your testing tool says the new version is winning by 18%. Should you ship it? This guide shows you how to plan a test, read the result and avoid the traps that fool smart teams, with every idea worked through on a fictional retailer's data in plain numbers, Excel and Python.

What you'll learn

  • Working out sample size and test length before you start
  • Reading p-values and confidence intervals without the myths
  • Handling revenue, outliers and skewed metrics
  • Catching peeking, sample ratio mismatch and segment fishing
  • Making tests faster with CUPED
  • Writing one-page results leaders act on

The paperback and Kindle editions are coming to Amazon soon.

📂 Free practice files on GitHub

How the books fit with the free lessons

Many of the topics in the books also have free video lessons and notebooks here. The books put them in a careful order, explain every line of code and add exercises with full solutions. The lessons show real projects being built on video. They work well together: read a chapter, then watch a lesson on the same topic and run its notebook. The learning paths are a good place to find those lessons.

Questions?

Leave a comment under any video on YouTube and I'll reply. Links to my own books on this page are ordinary links, not affiliate links.