 Mathew K Analytics
Lesson 27 · Data Science Projects
Building Accurate Disease Prediction Models with Machine Learning: A Step-by-Step Guide
Learn how data mining helps in predicting diseases. Understand why these models are important in healthcare. We use real medical data for hands-on learning.…
- CourseData Science Projects
- Lesson27 of 33
- Video25 min
- FormatJupyter notebook · 20 code cells
What you'll learn
Data
No separate download needed — the notebook creates or downloads everything it uses.
📓 Full notebook
Download .ipynbDisease Prediction Using Machine Learning#
- Learn how data mining helps in predicting diseases.
- Understand why these models are important in healthcare.
- We use real medical data for hands-on learning.
What will you learn?#
- How to load a classic medical dataset for diabetes prediction.
- Understand how to clean and explore the data.
- Build a basic machine learning model for disease prediction.
- Learn to evaluate model accuracy and spot important features.
- Visualize your results so they are easy to understand.
# Always start by ignoring future warnings
import warnings; warnings.filterwarnings("ignore")
import numpy as np
np.random.seed(42)
# Data setup
import pandas as pd
url = 'https://raw.githubusercontent.com/jbrownlee/Datasets/master/pima-indians-diabetes.data.csv'
cols = ['Pregnancies','Glucose','BloodPressure','SkinThickness','Insulin','BMI','DiabetesPedigree','Age','Outcome']
df = pd.read_csv(url, names=cols)
print(df.shape)
print(df.head(3))
# What do the columns mean?
for col in df.columns:
    print(col)
# Check for missing values
print(df.isnull().sum())
# Quick data summary
print(df.describe())
# Check for zeros as missing in medical columns
cols_check = ['Glucose', 'BloodPressure', 'SkinThickness', 'Insulin', 'BMI']
for c in cols_check:
    zero_count = (df[c] == 0).sum()
    print(f"{c}: {zero_count} zeros")
# Replace zeros with column median for selected features
for c in cols_check:
    df[c] = df[c].replace(0, df[c].median())
print(df[cols_check].head(3))
Explore patterns in your data#
- Relationships between features can help us understand risk factors.
- Visual exploration is a great first step before modeling.
# Plot histograms for features
import matplotlib.pyplot as plt
df.hist(bins=15, figsize=(12,7))
plt.tight_layout()
plt.show()

# Visualize glucose by outcome using a boxplot
import seaborn as sns
sns.boxplot(data=df, x='Outcome', y='Glucose')
plt.title('Glucose by Diabetes Outcome')
plt.show()

# See how many have diabetes vs not
sns.countplot(x='Outcome', data=df)
plt.title('Class Balance: Diabetes')
plt.show()

# Set up features and label arrays
X = df.drop('Outcome', axis=1)
y = df['Outcome']
print(X.shape, y.shape)
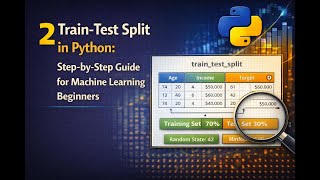
# Split to train and test sets
from sklearn.model_selection import train_test_split
X_train, X_test, y_train, y_test = train_test_split(X, y, test_size=0.2, random_state=42)
print(X_train.shape, X_test.shape)
Let us train a machine learning model#
- We will use logistic regression for this example.
- It is a common and interpretable method in medicine.
- This will help us predict the risk of diabetes from patient records.
# Train logistic regression model
from sklearn.linear_model import LogisticRegression
model = LogisticRegression(max_iter=500, solver='lbfgs')
model.fit(X_train, y_train)
print('Training complete.')
# Predict and check accuracy
from sklearn.metrics import accuracy_score
y_pred = model.predict(X_test)
acc = accuracy_score(y_test, y_pred)
print(f"Test Accuracy: {acc:.2f}")
# Confusion matrix to see detailed results
from sklearn.metrics import confusion_matrix, ConfusionMatrixDisplay
cm = confusion_matrix(y_test, y_pred)
disp = ConfusionMatrixDisplay(cm, display_labels=['No Diabetes','Diabetes'])
disp.plot()
plt.show()

# Which features matter most?
import numpy as np
coef = model.coef_[0]
for name, value in zip(X.columns, coef):
    print(f'{name}: {value:.2f}')
# Try the model on a new patient (input example)
input_vals = []
for c in X.columns:
    val = float(input(f'Enter {c}: '))
    input_vals.append(val)
prediction = model.predict([input_vals])[0]
if prediction == 1:
    print('Prediction: Diabetes present')
else:
    print('Prediction: No diabetes')
What did you just build?#
- You loaded real health data and fixed any data problems.
- You found patterns using charts and basic statistics.
- You trained, tested, and checked the results of a machine learning model.
- You predicted outcomes for example patients.
- You interpreted which features matter most.
# Stretch: Try a random forest for extra accuracy
from sklearn.ensemble import RandomForestClassifier
rf = RandomForestClassifier(n_estimators=100, random_state=42)
rf.fit(X_train, y_train)
rf_acc = rf.score(X_test, y_test)
print(f"Random Forest Test Accuracy: {rf_acc:.2f}")
# Mini project: Try predicting a new disease outcome!
# 1. Find a different health dataset online.
# 2. Load, clean, and explore it with these same steps.
# 3. Train a classifier, make predictions, and visualize results.
# Share your project with a friend and teach them what you learned.
"If you enjoyed this, subscribe to our channel for more fun projects!"
Found this useful?
All lessons, notebooks and datasets here are free. If they helped you, a coffee keeps new lessons coming.
Related lessons
 13 min
Lesson 15
Building a Heart Disease Classification Model in Python: Step-by-Step Machine Learning Guide
 22 min
Lesson 29
Predicting Diabetes Using Ensemble Machine Learning Models: A Step-by-Step Guide
 21 min
Lesson 3
Comprehensive Guide to Training Machine Learning Models with Scikit-Learn in Python
 12 min
Lesson 4