 Mathew K Analytics
Finance and Stock Market Analytics
A free 16-lesson course. Every lesson has a video walkthrough and a Jupyter notebook you can download or open in Google Colab; 4 lessons include real datasets. Tools covered: pandas, yfinance, NumPy, Matplotlib, datetime, seaborn.
 23 min
Lesson 1
Introduction to Technical Analysis for Finance and Stock Market Analytics
 35 min
Lesson 2
Understanding Financial Markets and Instruments: Key Concepts and Analytics
 24 min
Lesson 3
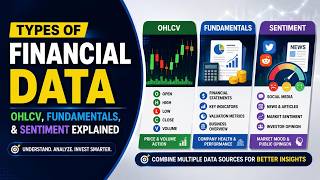
Types of Financial Data: OHLCV, Fundamentals, and Sentiment Explained
 26 min
Lesson 4
Financial Analytics Workflow Using Python: Step-by-Step Training for Beginners
 24 min
Lesson 8
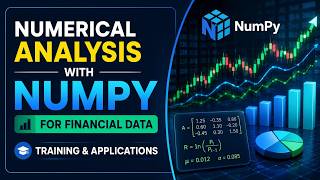
Numerical Analysis with NumPy for Financial Data: Training and Applications
 20 min
Lesson 9
Introduction to Pandas for Stock Data Analysis
 24 min
Lesson 11
Structure of Stock Market Datasets for Analytical Training
 24 min
Lesson 12
Understanding OHLCV Data in Finance: Open, High, Low, Close, and Volume Explained
 23 min
Lesson 15
Assessing Financial Data Quality: Techniques and Best Practices for Accurate Analysis
 23 min
Lesson 20
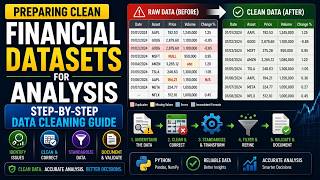
Preparing Clean Financial Datasets for Analysis: Step-by-Step Data Cleaning Guide
 25 min
Lesson 44
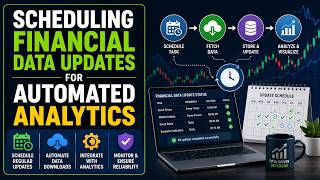
Scheduling Financial Data Updates for Automated Analytics
 23 min
Lesson 46
Introduction to Time Series in Finance: Key Concepts and Applications
 28 min
Lesson 49
Moving Averages and Smoothing Techniques in Stock Market Analysis
 23 min
Lesson 50
Seasonal Patterns in Financial Markets: Understanding Recurring Trends
 22 min
Lesson 57
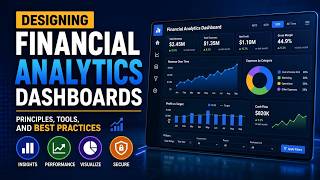
Designing Financial Analytics Dashboards: Principles, Tools, and Best Practices
 28 min
Lesson 60