 Mathew K Analytics
Statistics for data analysts
A free 15-lesson course. Every lesson has a video walkthrough and a Jupyter notebook you can download or open in Google Colab; 14 lessons include real datasets. Tools covered: NumPy, pandas, SciPy, Matplotlib, statsmodels, itertools.
- Lessons15
- Videoabout 4 hours
- LevelBeginner to intermediate
- PriceFree
- Datasets14
About this course
Statistics for Data Analysts covers the statistics you actually use at work, in Python. You start with probability and distributions, see why the central limit theorem matters, and learn how sampling bias creeps in. Then you put it to use: confidence intervals, hypothesis tests, A/B testing and experiment design, non-parametric tests, multiple-comparison corrections, linear and multiple regression with diagnostics, chi-square tests for categorical data and a first look at Bayesian thinking. A capstone ties everything together on a real analysis.
Statistics for data analysts is a free beginner to intermediate course with 15 video lessons (about 4 hours of video in total). It starts with “Probability Foundations for Data Analysts | Statistics #1” and finishes with “Statistics Capstone: A Full Real-World Analysis | Statistics #15”. Every lesson comes with the exact Jupyter notebook used in the video, and 14 of them include the dataset, so you can follow along with the same data.
Along the way you'll use NumPy, pandas, SciPy, Matplotlib, statsmodels and itertools.
It suits analysts who know basic Python and pandas and want to make decisions from data with confidence.
What you'll be able to do
- Explain probability, the binomial, Poisson and normal distributions, and the central limit theorem
- Spot sampling bias and build honest confidence intervals
- Run and interpret hypothesis tests, including A/B tests and non-parametric tests
- Correct p-values when you test many things at once
- Fit simple and multiple linear regression and check the model's assumptions
- Analyse categorical data with chi-square tests
- Read a Bayesian result and know when it helps
All 15 lessons
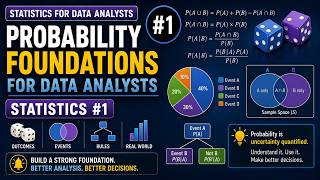 17 min
Probability Foundations for Data Analysts | Statistics #1
 16 min
Discrete Distributions Explained: Binomial & Poisson | Statistics #2
 18 min
Continuous Distributions & the Normal Curve | Statistics #3
 14 min
The Central Limit Theorem, Finally Explained | Statistics #4
 16 min
Sampling Methods & How Bias Sneaks In | Statistics #5
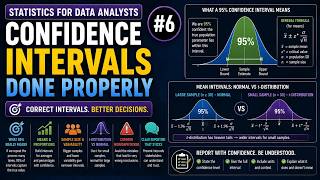 16 min
Confidence Intervals Done Properly | Statistics #6
 16 min
Hypothesis Testing Fundamentals | Statistics #7
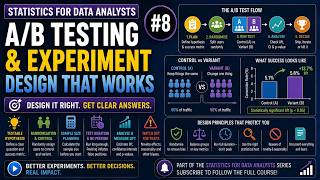 16 min
A/B Testing & Experiment Design That Works | Statistics #8
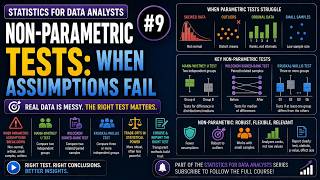 12 min
Non-Parametric Tests: When Assumptions Fail | Statistics #9
 13 min
Multiple Comparisons & P-Value Corrections | Statistics #10
 13 min
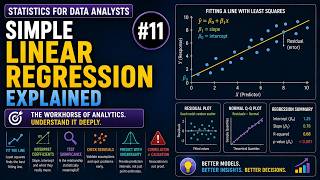
Simple Linear Regression Explained | Statistics #11
 13 min
Multiple Regression & Model Diagnostics | Statistics #12
 15 min
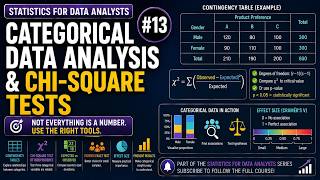
Categorical Data Analysis & Chi-Square Tests | Statistics #13
 15 min
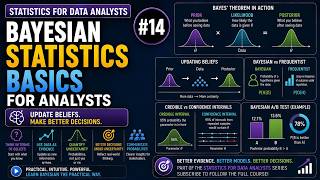
Bayesian Statistics Basics for Analysts | Statistics #14
 15 min
Statistics Capstone: A Full Real-World Analysis | Statistics #15
Frequently asked questions
Is the Statistics for data analysts course free?
Yes. All 15 videos, notebooks and datasets are free, with no sign-up.
Do I need to install anything?
No. You can open each notebook in Google Colab in your browser, or download it and run it in Jupyter or VS Code with Anaconda installed.
How long does the Statistics for data analysts course take?
The videos add up to about 4 hours. Most learners take one to two lessons a day, so plan on 2 to 4 weeks if you code along.
What level is it?
Beginner to intermediate. It suits analysts who know basic Python and pandas and want to make decisions from data with confidence.