 Mathew K Analytics
Lesson 7 · Probability and Statistics in python
Foundations of Probability: Understanding Events, Outcomes, and Sample Space
Welcome! You are about to explore the basics of probability and statistics using Python. By the end, you will know what events, outcomes, and sample space…
- CourseProbability and Statistics in python
- Lesson7 of 35
- Video11 min
- FormatJupyter notebook · 15 code cells
What you'll learn
Data
No separate download needed — the notebook creates or downloads everything it uses.
📓 Full notebook
Download .ipynbIntroduction to Probability: Events, Outcomes, and Sample Space#
Welcome! You are about to explore the basics of probability and statistics using Python.
By the end, you will know what events, outcomes, and sample space mean.
You will even practice with real and simulated data.
Let us begin our journey into the world of chance and data.
# Let us import needed libraries and suppress warnings
import warnings
warnings.filterwarnings("ignore")
import numpy as np
import pandas as pd
import matplotlib.pyplot as plt
import seaborn as sns
What is Probability?#
Probability is the math of chance.
It answers questions like:
- What are the chances of rain tomorrow?
- Will a coin flip land heads up?
- How likely is it to draw a red card?
Let us learn more about the building blocks of probability.
# A coin flip: Let's simulate it
flip = np.random.choice(["Heads", "Tails"])
print("You flipped:", flip)
Events, Outcomes, and Sample Space Explained#
An outcome is a single result of an experiment (like 'Heads').
An event is a set of one or more outcomes you care about (like getting 'Heads').
The sample space is the set of all possible outcomes (like both 'Heads' and 'Tails').
These ideas help us compute probabilities.
# Let us list the sample space for a simple coin toss
sample_space = ["Heads", "Tails"]
print("Sample space:", sample_space)
Probability of Each Outcome#
If all outcomes are equally likely, each one gets the same probability.
Probability = (Number of outcomes you want) / (Total number of outcomes)
For a fair coin:
- P(Heads) = 1/2
- P(Tails) = 1/2
# Calculate probability for fair coin
p_heads = 1 / 2
p_tails = 1 / 2
print("Probability of Heads:", p_heads)
print("Probability of Tails:", p_tails)
# Let us list the sample space for rolling a six-sided die
die_sample_space = [1, 2, 3, 4, 5, 6]
print("Sample space for a die:", die_sample_space)
# Probability of rolling a "3" with a fair die
p_three = 1 / len(die_sample_space)
print("Probability of rolling a 3:", p_three)
# Now, let us simulate 20 rolls of a die and count how many times we see a 6
rolls = np.random.choice(die_sample_space, size=20, replace=True)
num_sixes = np.sum(rolls == 6)
print("Rolls:", rolls)
print("Number of sixes:", num_sixes)
Descriptive Statistics: Mean, Median, Mode#
Descriptive statistics help us describe data with numbers.
- The mean is the 'average.'
- The median is the middle value.
- The mode is the most common value.
Let us see these in action.
# Use your list of die rolls above. Find mean, median, and mode.
mean_roll = np.mean(rolls)
median_roll = np.median(rolls)
mode_roll = pd.Series(rolls).mode()[0]
print("Mean:", mean_roll)
print("Median:", median_roll)
print("Mode:", mode_roll)
# What if data is missing? Let us create a new list with missing values.
rolls_missing = np.append(rolls, [np.nan, np.nan])
print("Rolls (with missing):", rolls_missing)
# Safe mean excluding missing data
mean_safe = np.nanmean(rolls_missing)
print("Mean (safe):", mean_safe)
Mini-Project: Simulate a Probability Experiment#
Let us run a mini-experiment where we flip a coin 100 times and record the results. Then, we will check how close our result is to the expected probability.
# Simulate 100 coin flips
n_flips = 100
coin_results = np.random.choice(["Heads", "Tails"], size=n_flips, replace=True)
heads_count = np.sum(coin_results == "Heads")
tails_count = np.sum(coin_results == "Tails")
print("Heads:", heads_count, "Tails:", tails_count)
print("Fraction Heads:", heads_count/n_flips)
# Plot the results of our 100 coin flips
sns.countplot(x=coin_results, palette="pastel");
plt.title("Coin Flip Results (100 Flips)");
plt.xlabel("Outcome"); plt.ylabel("Count");
plt.show()

# [Mini-Project Part 2] Explore a real dataset: Titanic sample
titanic = sns.load_dataset("titanic")
print("Titanic shape:", titanic.shape)
titanic.head()
# What fraction of Titanic passengers survived?
survived_rate = titanic["survived"].mean()
print("Survival rate:", survived_rate)
Best Practices & Troubleshooting#
- Always check your sample space before calculating probabilities.
- Simulate events to get hands-on understanding.
- Work with real data to see how concepts apply.
If code gives an error, read the message closely.
If you get stuck, share your code with a friend or instructor.
# Practice: Try flipping a coin as many times as you want!
times = int(input("How many times would you like to flip the coin? "))
results = np.random.choice(["Heads", "Tails"], size=times)
print("Flip results:", results)
# Challenge: What is the probability of getting at least one six in three dice rolls?
tries = 10000
success = 0
for _ in range(tries):
    rolls = np.random.choice([1,2,3,4,5,6], size=3)
    if 6 in rolls:
        success += 1
print("Simulated probability:", success / tries)
Recap: What Did We Learn?#
- Probability is about chance and outcomes.
- We learned what events and sample space mean.
- We used code to simulate experiments.
- We practiced with real data.
Try simulating more experiments yourself. Ask questions. Keep exploring!
Thanks for learning Probability with Python!#
Practice what you learned today.
If you enjoyed this lesson, please like, subscribe, and share it with friends!
Stay curious and keep experimentingprobability is everywhere.
Found this useful?
All lessons, notebooks and datasets here are free. If they helped you, a coffee keeps new lessons coming.
Related lessons
 17 min
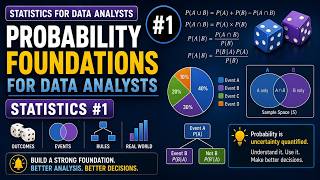
Probability Foundations for Data Analysts | Statistics #1
 10 min
Understanding Probability Distributions in Python with SciPy for Statistical Analysis
 16 min
Foundations of Time Series Analysis: Understanding Trend and Seasonality in Data
 23 min