 Mathew K Analytics
Probability and Statistics in python
A free 35-lesson course. Every lesson has a video walkthrough and a Jupyter notebook you can download or open in Google Colab. Tools covered: NumPy, pandas, Matplotlib, seaborn, SciPy, scikit-learn.
- Lessons35
- Videoabout 9 hours
- LevelBeginner to intermediate
- PriceFree
About this course
Probability and Statistics in python is a free beginner to intermediate course with 35 video lessons (about 9 hours of video in total). It starts with “Setting Up Python Jupyter Notebooks for Probability and Statistics Analysis” and finishes with “Comprehensive Statistical Analysis: Step-by-Step Capstone Project Case Study”. Every lesson comes with the exact Jupyter notebook used in the video, so you can run every step yourself.
Along the way you'll use NumPy, pandas, Matplotlib, seaborn, SciPy and scikit-learn.
It suits learners who already know basic Python (variables, lists, loops and functions) and want to apply it to real problems.
Course outline
- Setting Up Python Jupyter Notebooks for Probability and Statistics Analysis – In this hands-on notebook, we will explore core ideas of probability and statistics using Python. You do not need any previous math or…
- Fundamentals of Data Visualization: Histograms, Boxplots, and Scatterplots Explained – Welcome! In this lesson, you will learn how to create simple and powerful graphs. We will use real datasets to make concepts easy and…
- Understanding Bernoulli, Binomial, and Poisson Discrete Probability Distributions – In this lesson, we will learn about three popular types: Bernoulli distribution Binomial distribution Poisson distribution These are core…
- Hypothesis Testing Explained: Concepts, Errors, and How to Interpret P-Values in Python – Welcome! Today we are learning how to compare groups, check if our results are real or by chance, and use statistics to make decisions. We…
- Understanding Monte Carlo Simulations in Python for Statistical Modeling and Analysis – Welcome! In this lesson, we will explore Monte Carlo simulations with practical Python examples. You will learn probability basics, run…
- Simple Linear Regression in Python: Model Fitting & Interpretation Guide – In this lesson, you will learn how to fit a straight line to data, predict values, and interpret results. We will use the classic 'mpg'…
- Logistic Regression Explained: Master Coefficients & Odds Ratios Easily – Welcome to today''s lesson! We will learn to read and interpret logistic regression outputs, focusing on coefficients and odds ratios. You…
- Understanding Bayesian Statistics: Foundations of Priors and Posteriors Explained – Welcome to your first hands-on lesson in Bayesian statistics! We will explore what priors and posteriors mean, why Bayes' rule matters,…
All 35 lessons
 25 min
Setting Up Python Jupyter Notebooks for Probability and Statistics Analysis
 7 min
Understanding Data Types: Categorical, Numerical, Continuous, and Discrete Explained
 10 min
Master Descriptive Statistics: Learn Mean, Median, and Mode in Python
 15 min
Measures of Spread Explained: Variance, Standard Deviation & Interquartile Range
 14 min
Fundamentals of Data Visualization: Histograms, Boxplots, and Scatterplots Explained
 11 min
Foundations of Probability: Understanding Events, Outcomes, and Sample Space
 11 min
Understanding Conditional Probability and Independence in Probability Theory
 24 min
Master Bayes Theorem: Real-Life Examples & Step-by-Step Probability Explained
 9 min
Understanding Bernoulli, Binomial, and Poisson Discrete Probability Distributions
 14 min
Understanding Continuous Probability Distributions: Uniform, Normal, and Exponential Explained
 13 min
Understanding Statistical Sampling and the Law of Large Numbers in Biblical Context
 14 min
Understanding the Central Limit Theorem: Key Concepts and Practical Applications
 12 min
Hypothesis Testing Explained: Concepts, Errors, and How to Interpret P-Values in Python
 11 min
Understanding t-Tests, Chi-Square Tests, and ANOVA in Python for Statistical Analysis
 16 min
Understanding Bootstrapping for Estimation and Confidence Intervals in Statistics
 12 min
Understanding Permutation Tests: A Flexible Approach to Hypothesis Testing
 17 min
Understanding Monte Carlo Simulations in Python for Statistical Modeling and Analysis
 21 min
Mastering Random Number Generation in Python Using NumPy: Techniques & Applications
 29 min
Practical Applications of Simulation Techniques in Statistical Analysis and Decision-Making
 13 min
Understanding Covariance and Correlation: Pearson and Spearman Explained
 12 min
Simple Linear Regression in Python: Model Fitting & Interpretation Guide
 11 min
Understanding Multiple Linear Regression with Python’s Statsmodels Library
 12 min
Understanding Regression Diagnostics: Residuals and Key Assumptions Explained
 10 min
Practical Regression Project: Predicting Housing Prices with Python and Data Analysis
 12 min
Logistic Regression Explained: Master Coefficients & Odds Ratios Easily
 14 min
Master Accuracy, Precision & Recall for Evaluating Classification Models in Python
 12 min
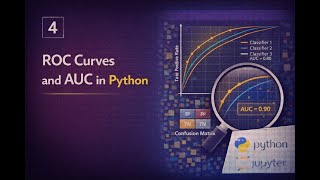
ROC Curve and AUC in Python: Beginner Guide with Seaborn
 24 min
Understanding Stationarity, ACF, PACF, and ARIMA Fundamentals in Time Series Analysis
 24 min
Understanding Bayesian Statistics: Foundations of Priors and Posteriors Explained
 15 min
Bayesian Estimation Explained: Using SciPy and PyMC for Practical Inference in Python
 21 min
Practical Applications of Bayesian Inference: Step-by-Step Examples and Analysis
 16 min
Understanding the Law of Large Numbers Through Dice Roll Simulations in Python
 19 min
Hypothesis Testing Explained: Applying Statistical Methods to Real-World Data
 12 min
Comprehensive Time Series Forecasting Project: From Data Preparation to Deployment
 34 min
Comprehensive Statistical Analysis: Step-by-Step Capstone Project Case Study
Frequently asked questions
Is the Probability and Statistics in python course free?
Yes. All 35 videos, notebooks are free, with no sign-up.
Do I need to install anything?
No. You can open each notebook in Google Colab in your browser, or download it and run it in Jupyter or VS Code with Anaconda installed.
How long does the Probability and Statistics in python course take?
The videos add up to about 9 hours. Most learners take one to two lessons a day, so plan on 5 to 9 weeks if you code along.
What level is it?
Beginner to intermediate. It suits learners who already know basic Python (variables, lists, loops and functions) and want to apply it to real problems.