Mathew K Analytics

Lesson 7 · Data analytics zero to hero

Pandas Series & DataFrames from Scratch | Data Analytics #7

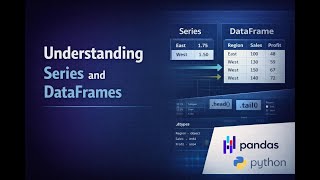
Video seven of the 30-part series, and the start of a multi-part pandas block: Series, DataFrames, and reading a real CSV file. We'll load the real mtcars…

What you'll learn

Datasets used in this lesson

Save these next to the notebook. In Google Colab, upload them with the 📁 icon on the left first.

📓 Full notebook

Download .ipynb

Data Analytics Zero to Hero, Video 7: Pandas Series and DataFrames#

  • Video seven of the 30-part series, and the start of a multi-part pandas block: Series, DataFrames, and reading a real CSV file.
  • We'll load the real mtcars dataset, 1974 Motor Trend car road tests, straight into pandas.
  • Let's jump straight in.

Before You Start#

  • Open a new Jupyter Notebook in VS Code and select your Python interpreter as the kernel.
  • Install pandas if you haven't already: pip install pandas.
  • Place mtcars.csv in the same folder as this notebook.

Part 1: The Series#

import pandas as pd

mpg = pd.Series([21.0, 22.8, 21.4, 18.7, 18.1])
print(mpg)
print(mpg.values)
print(mpg.index)
0    21.0
1    22.8
2    21.4
3    18.7
4    18.1
dtype: float64
[21.  22.8 21.4 18.7 18.1]
RangeIndex(start=0, stop=5, step=1)
mpg_named = pd.Series([21.0, 22.8, 21.4], index=['Mazda RX4', 'Datsun 710', 'Hornet 4 Drive'])
print(mpg_named)
print(mpg_named['Datsun 710'])
Mazda RX4         21.0
Datsun 710        22.8
Hornet 4 Drive    21.4
dtype: float64
22.8

Part 2: Building a DataFrame#

data = {
    'model': ['Mazda RX4', 'Datsun 710', 'Hornet 4 Drive'],
    'mpg': [21.0, 22.8, 21.4],
    'cyl': [6, 4, 6]
}
df = pd.DataFrame(data)
print(df)
            model   mpg  cyl
0       Mazda RX4  21.0    6
1      Datsun 710  22.8    4
2  Hornet 4 Drive  21.4    6

Part 3: Reading a Real CSV File#

df = pd.read_csv('mtcars.csv')
print(df.head())
               model   mpg  cyl   disp   hp  drat     wt   qsec  vs  am  gear  \
0          Mazda RX4  21.0    6  160.0  110  3.90  2.620  16.46   0   1     4   
1      Mazda RX4 Wag  21.0    6  160.0  110  3.90  2.875  17.02   0   1     4   
2         Datsun 710  22.8    4  108.0   93  3.85  2.320  18.61   1   1     4   
3     Hornet 4 Drive  21.4    6  258.0  110  3.08  3.215  19.44   1   0     3   
4  Hornet Sportabout  18.7    8  360.0  175  3.15  3.440  17.02   0   0     3   

   carb  
0     4  
1     4  
2     1  
3     1  
4     2  
print(df.tail(3))
print(df.shape)
print(df.columns)
print(df.dtypes)
            model   mpg  cyl   disp   hp  drat    wt  qsec  vs  am  gear  carb
29   Ferrari Dino  19.7    6  145.0  175  3.62  2.77  15.5   0   1     5     6
30  Maserati Bora  15.0    8  301.0  335  3.54  3.57  14.6   0   1     5     8
31     Volvo 142E  21.4    4  121.0  109  4.11  2.78  18.6   1   1     4     2
(32, 12)
Index(['model', 'mpg', 'cyl', 'disp', 'hp', 'drat', 'wt', 'qsec', 'vs', 'am',
       'gear', 'carb'],
      dtype='object')
model     object
mpg      float64
cyl        int64
disp     float64
hp         int64
drat     float64
wt       float64
qsec     float64
vs         int64
am         int64
gear       int64
carb       int64
dtype: object
df.info()
<class 'pandas.core.frame.DataFrame'>
RangeIndex: 32 entries, 0 to 31
Data columns (total 12 columns):
 #   Column  Non-Null Count  Dtype  
---  ------  --------------  -----  
 0   model   32 non-null     object 
 1   mpg     32 non-null     float64
 2   cyl     32 non-null     int64  
 3   disp    32 non-null     float64
 4   hp      32 non-null     int64  
 5   drat    32 non-null     float64
 6   wt      32 non-null     float64
 7   qsec    32 non-null     float64
 8   vs      32 non-null     int64  
 9   am      32 non-null     int64  
 10  gear    32 non-null     int64  
 11  carb    32 non-null     int64  
dtypes: float64(5), int64(6), object(1)
memory usage: 3.1+ KB
print(df.describe())
             mpg        cyl        disp          hp       drat         wt  \
count  32.000000  32.000000   32.000000   32.000000  32.000000  32.000000   
mean   20.090625   6.187500  230.721875  146.687500   3.596563   3.217250   
std     6.026948   1.785922  123.938694   68.562868   0.534679   0.978457   
min    10.400000   4.000000   71.100000   52.000000   2.760000   1.513000   
25%    15.425000   4.000000  120.825000   96.500000   3.080000   2.581250   
50%    19.200000   6.000000  196.300000  123.000000   3.695000   3.325000   
75%    22.800000   8.000000  326.000000  180.000000   3.920000   3.610000   
max    33.900000   8.000000  472.000000  335.000000   4.930000   5.424000   

            qsec         vs         am       gear     carb  
count  32.000000  32.000000  32.000000  32.000000  32.0000  
mean   17.848750   0.437500   0.406250   3.687500   2.8125  
std     1.786943   0.504016   0.498991   0.737804   1.6152  
min    14.500000   0.000000   0.000000   3.000000   1.0000  
25%    16.892500   0.000000   0.000000   3.000000   2.0000  
50%    17.710000   0.000000   0.000000   4.000000   2.0000  
75%    18.900000   1.000000   1.000000   4.000000   4.0000  
max    22.900000   1.000000   1.000000   5.000000   8.0000  

Part 4: Selecting Columns#

mpg_col = df['mpg']
print(type(mpg_col))
print(mpg_col.head())
<class 'pandas.core.series.Series'>
0    21.0
1    21.0
2    22.8
3    21.4
4    18.7
Name: mpg, dtype: float64
subset = df[['model', 'mpg', 'hp']]
print(type(subset))
print(subset.head())
<class 'pandas.core.frame.DataFrame'>
               model   mpg   hp
0          Mazda RX4  21.0  110
1      Mazda RX4 Wag  21.0  110
2         Datsun 710  22.8   93
3     Hornet 4 Drive  21.4  110
4  Hornet Sportabout  18.7  175

Part 5: Selecting Rows with loc and iloc#

print(df.iloc[0])
print(df.iloc[0:3])
model    Mazda RX4
mpg           21.0
cyl              6
disp         160.0
hp             110
drat           3.9
wt            2.62
qsec         16.46
vs               0
am               1
gear             4
carb             4
Name: 0, dtype: object
           model   mpg  cyl   disp   hp  drat     wt   qsec  vs  am  gear  \
0      Mazda RX4  21.0    6  160.0  110  3.90  2.620  16.46   0   1     4   
1  Mazda RX4 Wag  21.0    6  160.0  110  3.90  2.875  17.02   0   1     4   
2     Datsun 710  22.8    4  108.0   93  3.85  2.320  18.61   1   1     4   

   carb  
0     4  
1     4  
2     1  
df_named = df.set_index('model')
print(df_named.loc['Fiat 128'])
print(df_named.loc['Fiat 128', 'mpg'])
mpg     32.40
cyl      4.00
disp    78.70
hp      66.00
drat     4.08
wt       2.20
qsec    19.47
vs       1.00
am       1.00
gear     4.00
carb     1.00
Name: Fiat 128, dtype: float64
32.4

Part 6: Boolean Filtering#

efficient = df[df['mpg'] > 25]
print(efficient[['model', 'mpg']])
             model   mpg
17        Fiat 128  32.4
18     Honda Civic  30.4
19  Toyota Corolla  33.9
25       Fiat X1-9  27.3
26   Porsche 914-2  26.0
27    Lotus Europa  30.4
v8_efficient = df[(df['cyl'] == 8) & (df['mpg'] > 15)]
print(v8_efficient[['model', 'cyl', 'mpg']])
                model  cyl   mpg
4   Hornet Sportabout    8  18.7
11         Merc 450SE    8  16.4
12         Merc 450SL    8  17.3
13        Merc 450SLC    8  15.2
21   Dodge Challenger    8  15.5
22        AMC Javelin    8  15.2
24   Pontiac Firebird    8  19.2
28     Ford Pantera L    8  15.8

Part 7: Adding Columns and Sorting#

df['kml'] = df['mpg'] * 0.425
print(df[['model', 'mpg', 'kml']].head())
               model   mpg     kml
0          Mazda RX4  21.0  8.9250
1      Mazda RX4 Wag  21.0  8.9250
2         Datsun 710  22.8  9.6900
3     Hornet 4 Drive  21.4  9.0950
4  Hornet Sportabout  18.7  7.9475
top_mpg = df.sort_values('mpg', ascending=False)
print(top_mpg[['model', 'mpg']].head())
             model   mpg
19  Toyota Corolla  33.9
17        Fiat 128  32.4
27    Lotus Europa  30.4
18     Honda Civic  30.4
25       Fiat X1-9  27.3

Wrap-Up: What You Learned#

  • The Series: a single labeled column, and the building block of every DataFrame.
  • Building a DataFrame from a dictionary, and reading one directly from a real CSV file with read_csv.
  • Exploring a new DataFrame: head, tail, shape, columns, dtypes, info, and describe.
  • Selecting columns with square brackets, and rows with loc and iloc.
  • Boolean filtering, including combining multiple conditions.
  • Adding a new computed column, and sorting with sort_values.
  • This is the pandas foundation everything else in this series builds on. Video eight moves into real-world data cleaning: missing values, duplicates, and data types. Subscribe so it lands automatically see you there.

Found this useful?

All lessons, notebooks and datasets here are free. If they helped you, a coffee keeps new lessons coming.