 Mathew K Analytics
Learn statsmodels with free notebooks
38 free video lessons that use statsmodels, each with a downloadable Jupyter notebook and, where needed, the dataset. Learn statsmodels by working through real examples.
About these statsmodels lessons
These 38 lessons come from 11 different courses, so you see statsmodels used in several settings. The course with the most statsmodels lessons is Probability and Statistics in python (9 lessons). 8 of the lessons include a real dataset to practise on.
statsmodels is most often used here together with pandas, Matplotlib, NumPy and SciPy.
Watch the video, then run the notebook yourself: changing the code and re-running it is the fastest way to learn.
Courses that use statsmodels
- Probability and Statistics in python – 9 lessons
- Python For Time Series – 9 lessons
- Statistics for data analysts – 5 lessons
- Data visualisation in python – 4 lessons
- Supply Chain Operations Analytics – 3 lessons
- Real-World Data Analytics – 2 lessons
- Market Research Analytics in Python – 2 lessons
- Data Mining Full Course – 1 lesson
- ML algorithms deep dive – 1 lesson
- Python for Retail E-commerce Analytics – 1 lesson
- Python for Banking and Finance – 1 lesson
Sales Forecasting in Python: Holt-Winters vs Baselines | Data Analytics #5

End-to-End Retail Analytics Project in Python (Portfolio Capstone) | Data Analytics #10
 3 h 42 min
Data Mining Full Course Part 6 (3.5 Hours): Time Series Forecasting & 5 Capstone Projects
 16 min
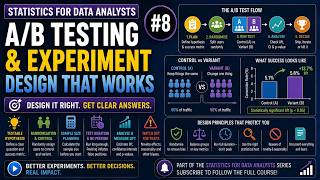
A/B Testing & Experiment Design That Works | Statistics #8
 13 min
Multiple Comparisons & P-Value Corrections | Statistics #10
 13 min
Multiple Regression & Model Diagnostics | Statistics #12
 15 min
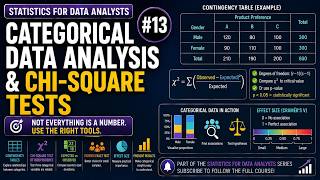
Categorical Data Analysis & Chi-Square Tests | Statistics #13
 15 min
Statistics Capstone: A Full Real-World Analysis | Statistics #15
 25 min
Linear Regression from Scratch in Python | ML Algorithms #1
 28 min
Correlation and Key Driver Analysis in Market Research
 20 min
Net Promoter Score Analysis in Python for Market Research
 25 min
Seasonal Demand Forecasting Training with Python for Retail E-commerce Analytics
 24 min
Master Bayes Theorem: Real-Life Examples & Step-by-Step Probability Explained
 12 min
Hypothesis Testing Explained: Concepts, Errors, and How to Interpret P-Values in Python
 17 min
Understanding Monte Carlo Simulations in Python for Statistical Modeling and Analysis
 13 min
Understanding Covariance and Correlation: Pearson and Spearman Explained
 11 min
Understanding Multiple Linear Regression with Python’s Statsmodels Library
 12 min
Understanding Regression Diagnostics: Residuals and Key Assumptions Explained
 24 min
Understanding Stationarity, ACF, PACF, and ARIMA Fundamentals in Time Series Analysis
 15 min
Bayesian Estimation Explained: Using SciPy and PyMC for Practical Inference in Python
 12 min
Comprehensive Time Series Forecasting Project: From Data Preparation to Deployment
 14 min
Master Data Cleaning and Preparation with Pandas in Python for Effective Bible Study Analysis
 13 min
Understanding Heatmaps and Correlation Matrices with Seaborn for Data Analysis
 13 min
Creating Interactive Choropleth Maps with Plotly for Python Geospatial Visualization
 14 min
3 - Interactive Maps with Folium
 14 min
Understanding Stationarity and the Augmented Dickey-Fuller Test in Time Series Analysis
 13 min
Understanding Autocorrelation and Partial Autocorrelation in Time Series Analysis
 10 min
Seasonal Decomposition in Python: Techniques for Time Series Analysis and Interpretation
 15 min
Understanding Autoregressive, Moving Average, and ARMA Models for Time Series Forecasting
 17 min
Seasonal ARIMA and SARIMAX in Python: A Guide to Time Series Forecasting
 12 min
Understanding Exponential Smoothing and Holt-Winters Forecasting Models in Python
 14 min
Understanding Model Diagnostics and Residual Analysis for Time Series Forecasting in Python
 15 min
Walk-Forward Validation in Python: A Clear Guide for Time Series Model Evaluation
 10 min
Using Multilayer Perceptrons for Time Series Forecasting in Christian Analytics
 24 min
Time Series Decomposition Techniques for Accurate Demand Forecasting in Supply Chain
 31 min
Moving Average and Exponential Smoothing Models in Supply Chain Analytics
 23 min
ARIMA and SARIMA for Demand Forecasting in Supply Chains
 21 min
Analyzing Transaction Trends and Seasonality in Finance Using Python
Frequently asked questions
Where should I start learning statsmodels?
Start with “Sales Forecasting in Python: Holt-Winters vs Baselines | Data Analytics #5”, then work through the Probability and Statistics in python course.
Are these statsmodels lessons free?
Yes. Every video, notebook and dataset on this site is free to use for learning.
Can I run the statsmodels notebooks without installing Python?
Yes. Open them in Google Colab, or use the Run in browser button where a lesson has one.